

Markets in a Minute - The Degree Divide: One Economy, Two Job Markets
The unemployment rate still offers a useful snapshot of the labor market, but the headline can miss important differences beneath the surface. Among workers ages 22 to 34, those without a college degree are experiencing some of the strongest job conditions of the past twenty years. College graduates in the same age group are having a much harder time, with unemployment near levels seen only during the pandemic and the years following the 2008 financial crisis. These groups historically moved in a similar direction, but they have recently diverged. That reversal has become a central piece of evidence in the debate over whether artificial intelligence is already displacing workers. The data offer a more complicated answer than the headlines suggest.
Key Takeaways
- Among workers ages 22 to 34, unemployment for those without a degree sits near the low end of its two-decade range. For college graduates, it sits near the high end. The two groups had moved together for twenty years.
- AI is absorbing some entry-level office work, but it is one of several forces. Retirements and slower immigration thinned the skilled trades just as the supply of degree holders kept growing.
A degree still pays. Among workers ages 25 to 54, graduates averaged 2.7% unemployment over the twelve months through July, versus 3.6% for some college and 4.7% for a high school diploma.
The unemployment rate counts only those working or actively looking. Nearly a quarter of younger workers with only a high school diploma are outside the labor force, which overstates the strength.
A Labor Market Moving in Opposite Directions
A closer look at the data helps explain why the labor market feels so different across education levels. The Burning Glass Institute, a labor-market research group, compared each group's current unemployment rate with its own history going back to 2003. Looking at the numbers, this way shows how unusual the recent divide has become.
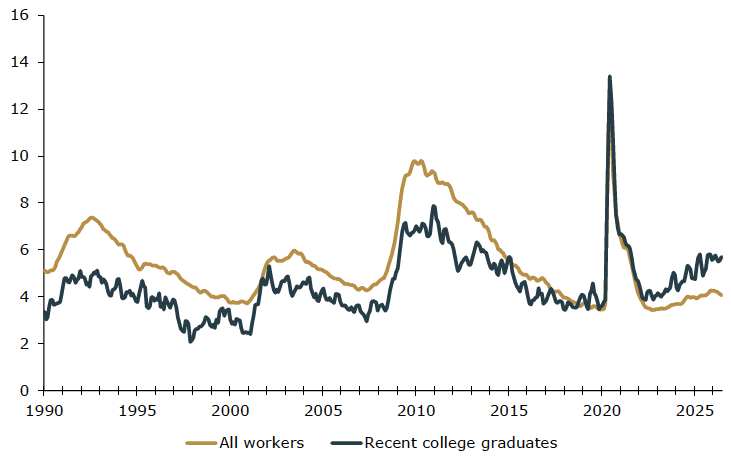
For twenty years, the workers with a college degree and those without tended to experience similar trends in employment. This year their paths diverged. Workers aged 22 to 34 without a degree now rank near the bottom of their own unemployment history, meaning conditions look about as good as they get. By contrast, college graduates the same age rank near the top, meaning they are finding it difficult to get a job, relative to previous periods. It has only been this hard for grads to find employment twice before, during the pandemic and during the slow climb out of the 2007 to 2009 recession.
A Two-Decade Labor Market Reversal: Unemployment Rate for All Workers and Recent College Graduates
Past performance is not a reliable indicator of current or future results. Indexes are unmanaged and not subject to fees. Forward-looking estimates may not come to pass. Source: Kestra Investment Management with data from U.S. Census Bureau and U.S. Bureau of Labor Statistics, Current Population Survey (IPUMS).Rates are seasonally adjusted and smoothed with a three-month moving average. All workers are those aged 16 to 65; college graduates are those aged 22 to 65 with a bachelor's degree or higher; recent college graduates are those aged 22 to 27 with a bachelor's degree or higher; young workers are those aged 22 to 27 without a bachelor's degree. All figures exclude those currently enrolled in school. Data as of August 6, 2026.
Why the Divide Is Growing
The divide begins with a basic imbalance between the supply of workers, and the types of jobs employers are trying to fill. In many skilled trades, retirements are reducing the workforce faster than younger workers are entering it, while slower immigration has limited another source of labor. With fewer qualified electricians, welders, and machinists available, employers often need to hire quickly and offer more competitive pay to retain experienced workers.
College graduates are facing the opposite dynamic. More Americans hold a bachelor's degree than ever before, creating a larger pool of candidates for professional roles. Artificial intelligence complicates the picture further. The drafting, summarizing, and first-pass analytical work that once filled a new graduate's first two years is exactly the work these tools handle most capably. That does not mean those jobs are disappearing. It may mean companies are hiring fewer people to do the same starting work, or asking new hires to begin further up the learning curve.
Where Hiring Is Holding Up
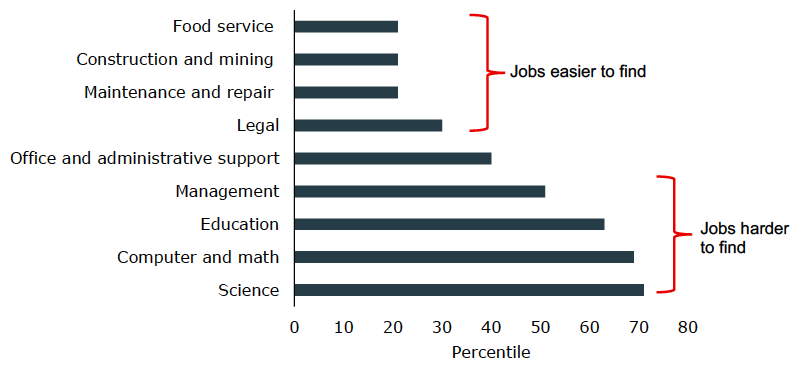
Looking at occupations rather than education levels reinforces the same pattern. Physical and in-person jobs generally compare more favorably with their own history. Science, computer, and mathematics roles rank near the seventieth percentile of historical unemployment, which is worse than normal. By contrast, construction and mining, maintenance and repair, and food service rank near the twentieth percentile, which is better than normal. The pattern lines up with what these tools can and cannot do. Software has moved quickly into work performed at a desk. It has not moved into work performed on a roof, in a crawlspace, or behind a line.
In-Person Jobs Are Holding Up Better
Past performance is not a reliable indicator of current or future results. Indexes are unmanaged and not subject to fees. Forward-looking estimates may not come to pass. Source: Kestra Investment Management with data from Burning Glass Institute. Note: 12-month moving average unemployment rate for age 16+, all education levels, compared with each group’s unemployment history since 2003; October 2025 interpolated.
The August employment report from the U.S. Bureau of Labor Statistics points in the same direction. Food services and drinking places added 59,000 jobs, accounting for more than one-third of the 162,000 jobs added across the economy. That concentration stands out because monthly job growth typically spread across a broader mix of industries. When one service category represents such a large share of net hiring, it suggests that demand for workers is not evenly distributed and remains especially strong in parts of the economy that depend on in-person labor.
What the Unemployment Rate Misses
Strong conditions relative to their own history do not mean it is easy to find work without a college degree. The broader labor market has settled into a low-hire, low-fire pattern in which employers are holding on to the workers they have but adding few new ones, which makes breaking in harder than a low unemployment rate suggests. The headline unemployment rate has an important limitation: it counts only people who are working or actively looking for a job. People who are in school, dealing with illness or disability, caring for family members, or discouraged after a long search are classified as outside the labor force. Because they are excluded from the calculation, the rate can improve even when some people have stopped searching rather than found work.
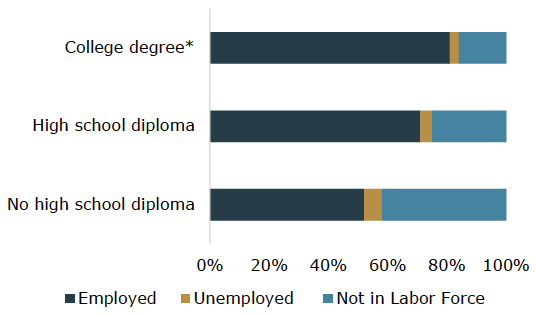
That distinction is especially important when comparing education groups. Among younger workers, nearly a quarter of those with only a high school diploma are outside the labor force, compared with roughly one in seven degree holders. As a result, part of the apparent strength in non-degree unemployment reflects who is no longer counted. The data still point to strong demand for many non-degree jobs, but the broader employment picture is less clear-cut than the unemployment rate alone suggests.
The Participation Gap Behind the Headline: Employment Status by Education (%), Ages 22-27
Past performance is not a reliable indicator of current or future results. Indexes are unmanaged and not subject to fees. Forward-looking estimates may not come to pass. Source: Kestra Investment Management with data from Brookings Institution. *Include those with higher degrees. Note: Data as of July 2026.
Why the Divide Matters for Investors
For investors, the divide matters because job and wage growth do not affect every part of the economy in the same way. When income gains are concentrated in trades, construction, and in-person services, the spending tends to reach different households, regions, and businesses than when professional and technology employment is leading. Stronger demand for skilled labor can also support building and infrastructure activity, which influences demand for industrial materials, equipment, and related services.
The second consideration is inflation. Wage pressure is often strongest in jobs where workers remain scarce and technology cannot easily replace the work. Skilled trades fit that description because many tasks must be performed on-site and require specialized experience. If those labor shortages continue, wage growth in these areas could keep some service costs elevated and make the path back to the Federal Reserve's inflation target less straightforward.
What Could Change the Story
Two questions decide how long this lasts. First, whether entry-level professional hiring recovers or whether companies settle into permanently smaller starting classes. Second, whether robotics and automation eventually reach into physical and service work the way software reached into office work. The current data cannot separate an AI effect from an ordinary hiring slowdown in professional roles, because both would look the same in the unemployment numbers. That is why the pattern is worth watching rather than declaring.
The broader lesson holds regardless. A single national number can hide two economies moving in opposite directions. Understanding where income grows matters more for long-term planning than tracking the headline that gets reported each month, and it rewards investors who stay diversified across the parts of the economy that take turns leading.
Invest wisely and live richly,
Ryan
The opinions expressed in this commentary are those of the author and may not necessarily reflect those held by Kestra Advisor Services Holdings C, Inc., d/b/a Kestra Holdings, and its subsidiaries, including, but not limited to, Kestra Advisory Services, LLC, Kestra Investment Services, LLC, Kestra Private Wealth Services, and Bluespring Wealth Partners, LLC. The material is for informational purposes only. It represents an assessment of the market environment at a specific point in time and is not intended to be a forecast of future events, or a guarantee of future results. It is not guaranteed by any entity for accuracy, does not purport to be complete and is not intended to be used as a primary basis for investment decisions. It should also not be construed as advice meeting the particular investment needs of any investor. Neither the information presented nor any opinion expressed constitutes a solicitation for the purchase or sale of any security. This material was created to provide accurate and reliable information on the subjects covered but should not be regarded as a complete analysis of these subjects. It is not intended to provide specific legal, tax or other professional advice. The services of an appropriate professional should be sought regarding your individual situation. Kestra Advisor Services Holdings C, Inc., d/b/a Kestra Holdings, and its subsidiaries, including, but not limited to, Kestra Advisory Services, LLC, Kestra Investment Services, LLC, Kestra Private Wealth Services, and Bluespring Wealth Partners, LLC, do not offer tax or legal advice.